6. Plotting tools#
Plotting functions can be used to visualize the optimization process.
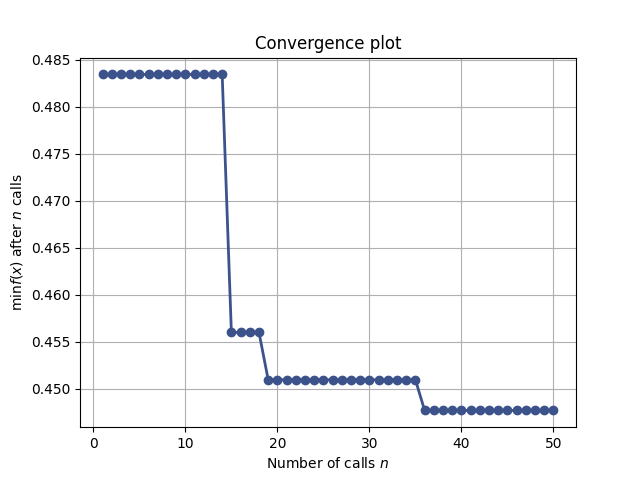
6.1. plot_convergence#
plot_convergence plots one or several convergence traces.
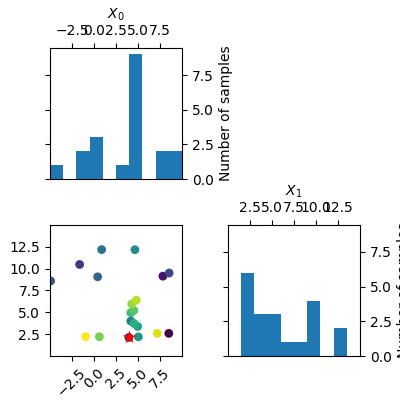
6.2. plot_evaluations#
plot_evaluations visualize the order in which points where sampled.
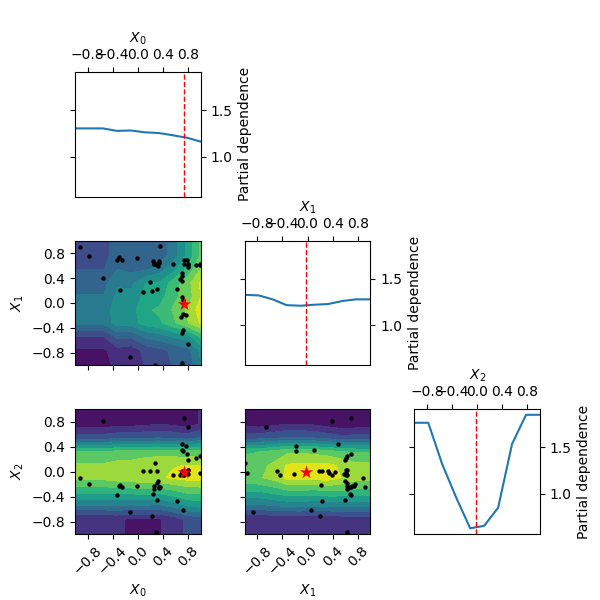
6.3. plot_objective#
plot_objective creates pairwise dependence plot of the objective function.
6.4. plot_regret#
plot_regret plot one or several cumulative regret traces.